
With the American markets at all-time highs, it could be time to start looking abroad for value. Argentina probably doesn´t pop into your mind when you think of investments, but the country is poised to offer more to the investor than just the wine, tango, and Lionel Messi.
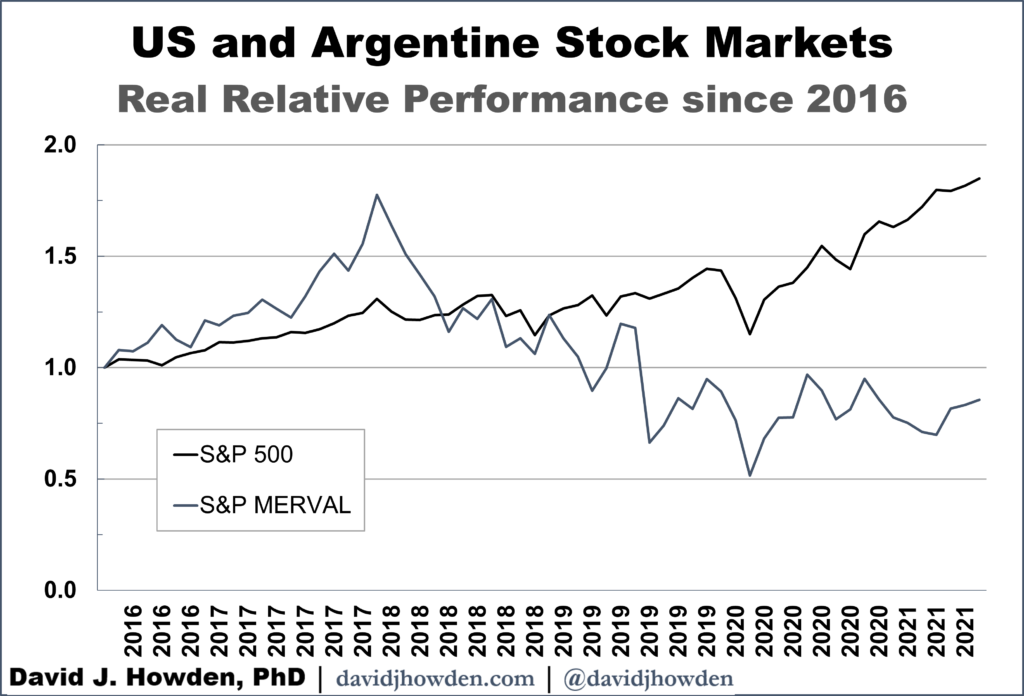
Consider that the S&P 500 is up nearly 35% year-on-year, and has averaged over 13% annually for more than a decade. How much further do you reasonably expect the American bull market to go?
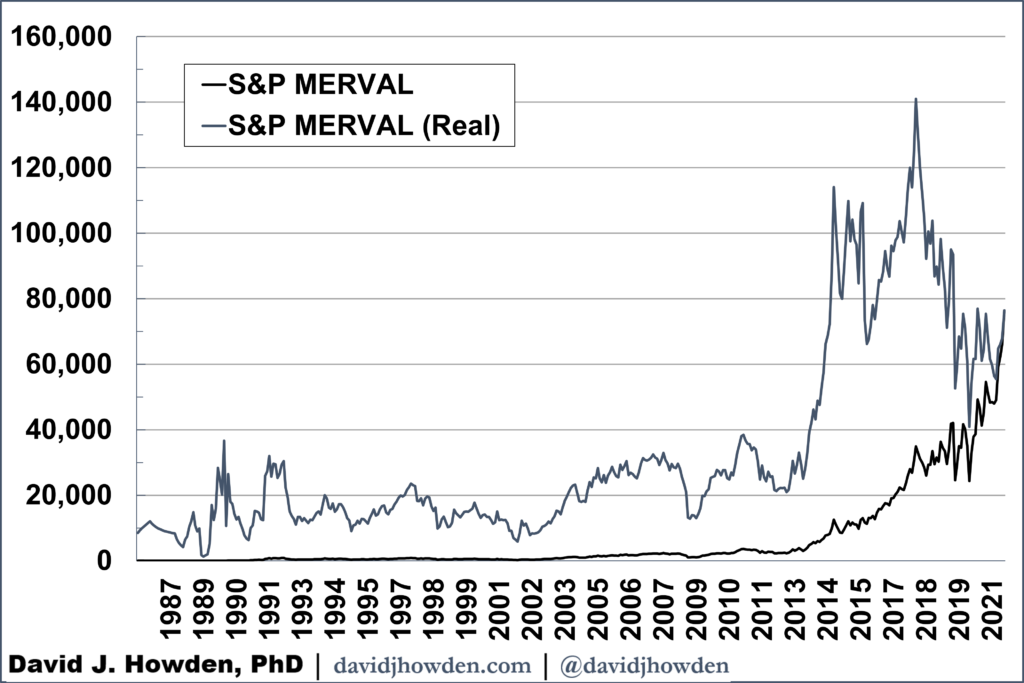
In contrast, Argentina´s main index, the S&P MERVAL, has been in freefall for most of the past four years, at least when adjusted for inflation. Between 2018 and 2020 it lost 71% of its value in real terms. And even though Argentine inflation ranks among the highest in the world, the index still lost over 30% in nominal terms over the period.
Since 2016 the S&P 500 has made a steady climb, with only a brief pause (in retrospect) back in early 2020. In contrast, the Argentine market has been in the doldrums since 2017. Plus, the S&P MERVAL is still lower today than at any points since 2014 (in inflation-adjusted terms).
It´s hard to get a feel for the performance of a volatile stock market like Argentina´s. One way is to compare the index´s return over some period, say five years, with what the investor would realize in inflation-adjusted terms and in terms of the more stable currency, like the US dollar. For the most part, Argentine inflation is high and the Argentine peso has depreciated strongly against the US dollar over the past thirty years. As a result, the nominal return of the stock index is higher than both the real and US dollar returns over all periods. But against this backdrop, we can see some periods where all three returns were stellar and others that were more lacklustre.
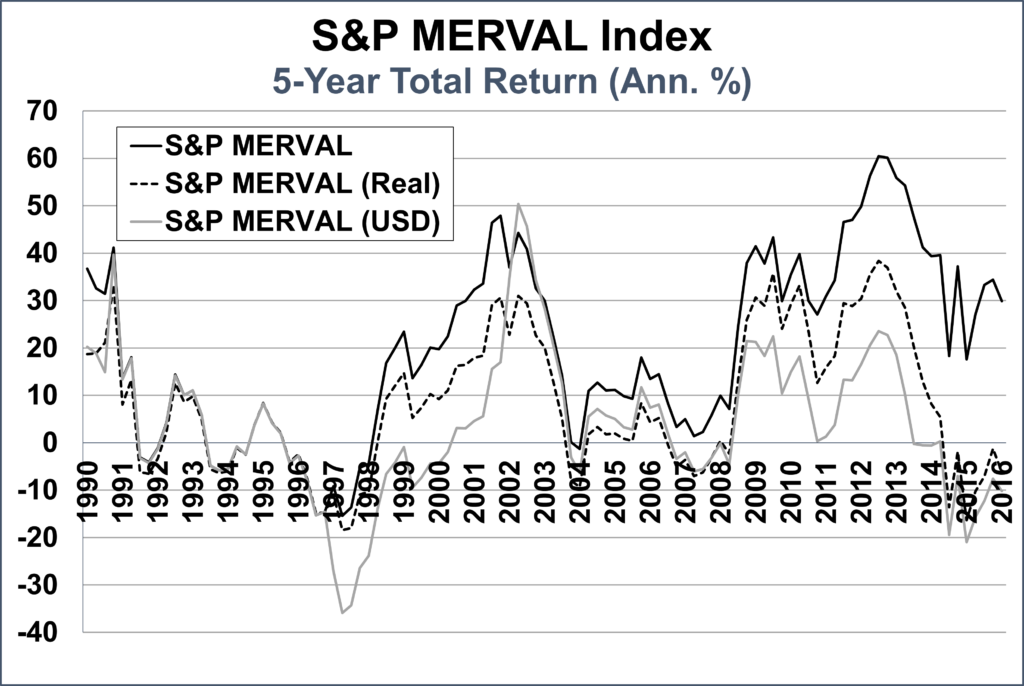
The investor who invested in Argentine equities in 1990, 2002, 2009, and 2012 saw US dollar returns of more than 20% annually over the following five years. (Between 2002 and 2007 the investor earned over 50% annually in US dollar terms.)
The investor earned a loss over the next five years if he bought the index in 1997, 2004, 2007, and 2015.
It would be helpful to see what are some factors that unite the years of superior returns and contrast them with those years that yielded losses. There are three major factors that signal deep value in Argentine equities.
The first is my measure of relative valuation, a figure that shows how under-priced a stock index is relative to other prices in the economy. You can think of the measure as a way to normalize stock prices over time as they swing from undervaluation to overvaluation.
Relative valuation is here expressed as a percentile. Having a percentile of 0.1 signals that the index is more expensive (or more overvalued) than only 10% of its history (i.e., that it is cheaper than just 10% of its history). A percentile of 0.9 would make the index more expensive (overvalued) than 90% of its past.
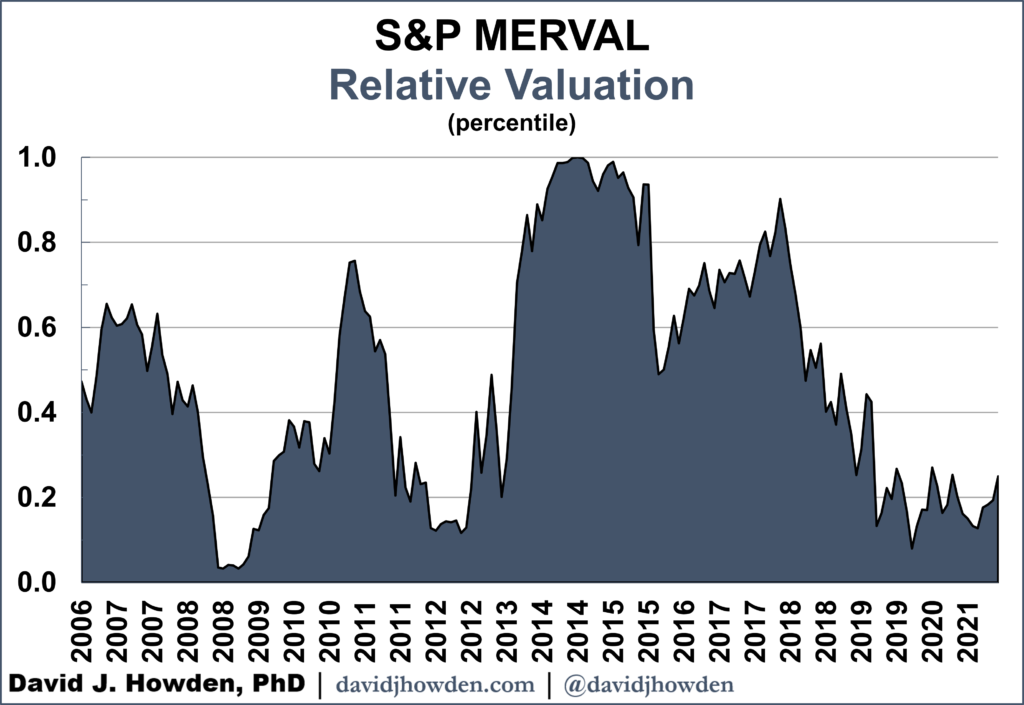
Looking at its relative valuation, the S&P MERVAL´s lows in 2009 and 2012 are apparent, and signal that Argentine equities represented good value at those times. In contrast, in 2014 the index was more overvalued than ever in its history. We now know that the investor who bought Argentine stocks that year would have suffered a loss of 20% annually over the next five years in US dollar terms (for a total loss of nearly 70% over the period).
2007, 2010, and 2018 were also years that the index was overvalued by this measure. Large declines accompanied each of these relative valuation peaks.
The S&P MERVAL is currently cheaper than 75% of its history. Its relative valuation has only been this low twice before: 2009 and 2012. In the five years following those lows the index yielded a more than 20% annual return in US dollar terms, 30% in real terms, and 40% in nominal terms.
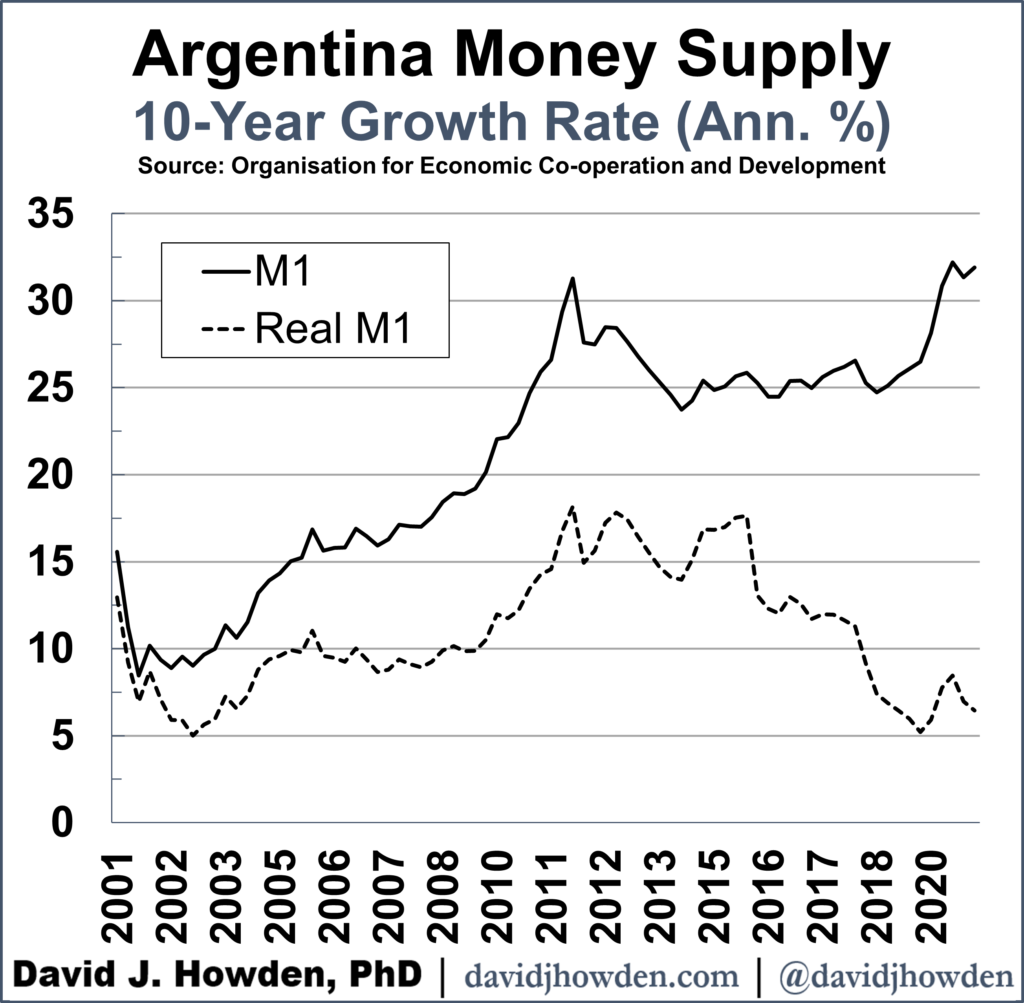
Some investors worry of inflation in Argentina, caused by the Central Bank of the Argentine Republic´s loose monetary policy. Such fears are well founded. In nominal terms the country´s money supply has grown by more than 31% annually over the past decade, a rate even higher than at its peak in 2011. Adjusting for inflation, the growth of money is much more muted in the country, averaging a little over 5% since 2011.
Investors get scared of inflation because it hurts real returns (if you are Argentine investing in pesos) or because it depreciates the currency´s exchange rate (if you are a foreigner converting your peso investment back to your home currency in the future).
While these two factors are real and compromise the investor´s bottom line, there is one factor that counteracts them. A loose monetary policy ends up lifting all prices, including the price of the stocks represented by the index.
Argentines will no doubt spend some of this new money washing through the economy on Malbec and alfajores. The companies that make these goods, and other goods that are also the object of the new spending, will see their sales and value increase. And, if history is any judge, some of this new money will find itself saved and invested directly in the stock market.
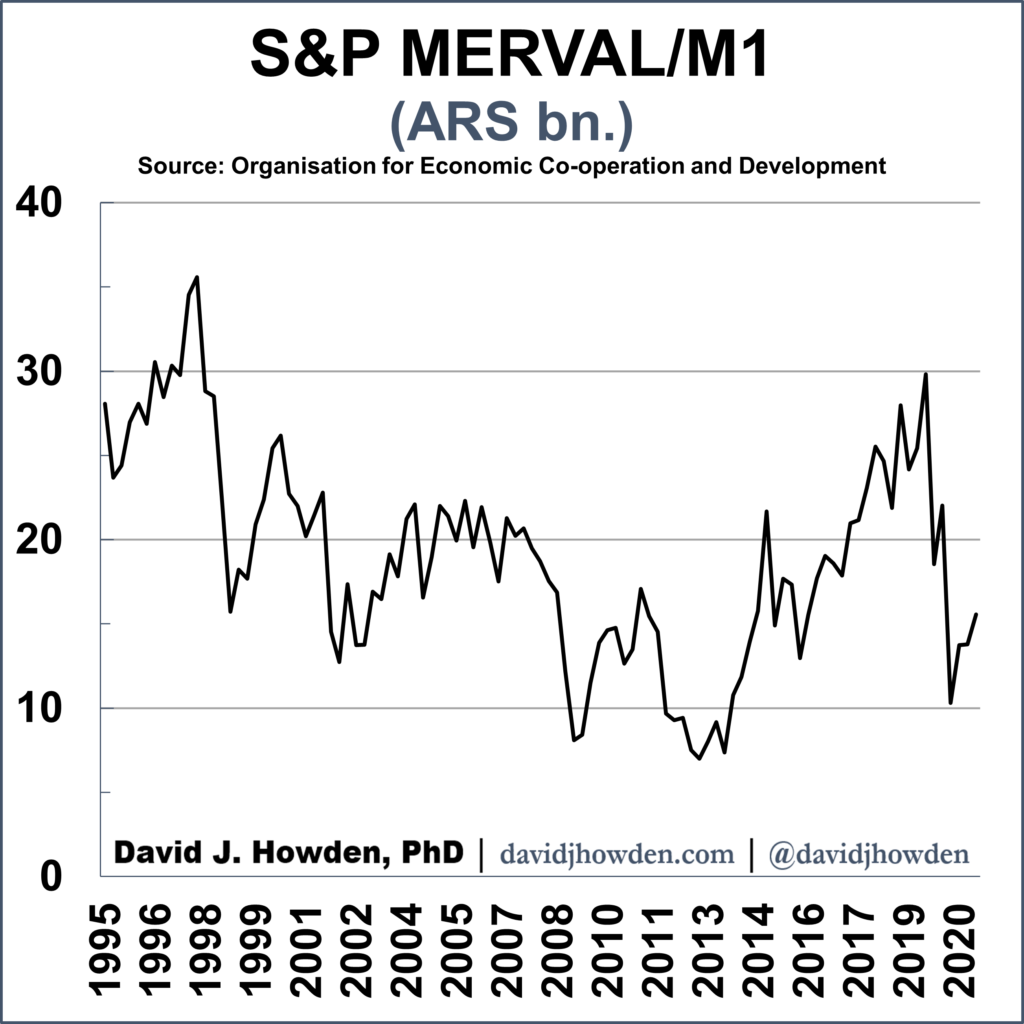
One way to see the relationship between the country´s money supply and the stock index is through the S&P MERVAL-to-M1 ratio. The figure represents the billions of Argentine pesos floating around the economy for every point of the index. A higher number denotes a more highly valued stock market relative to the stock of money.
Since records of this figure begin in 1995, we can see the major market tops all coinciding with peaks in this ratio. This is especially noticeable in 1997, 2000, 2007, 2014, and 2019. Each of these peaks was followed by a substantial collapse.
The ratio´s lows in 1998, 2002, 2009, and 2012 were all followed by large advances. The ratio bottomed recently in 2020Q2, with each point of the S&P MERVAL counting for AR$10.3 bn. of the country´s M1 money supply. The ratio has increased somewhat since then, but at 13.6 is still quite low by historical standards. It is also still far below the recent 2019 peak.
Of course there is a way to look at how much of the newly printed money is working its way into the general economy versus the stock market. Taking the ratio of the MERVAL to Argentine GDP tells us how many pesos of income are generated for each point of the index. As the ratio increases the stock market becomes more highly valued relative to the underlying economy.
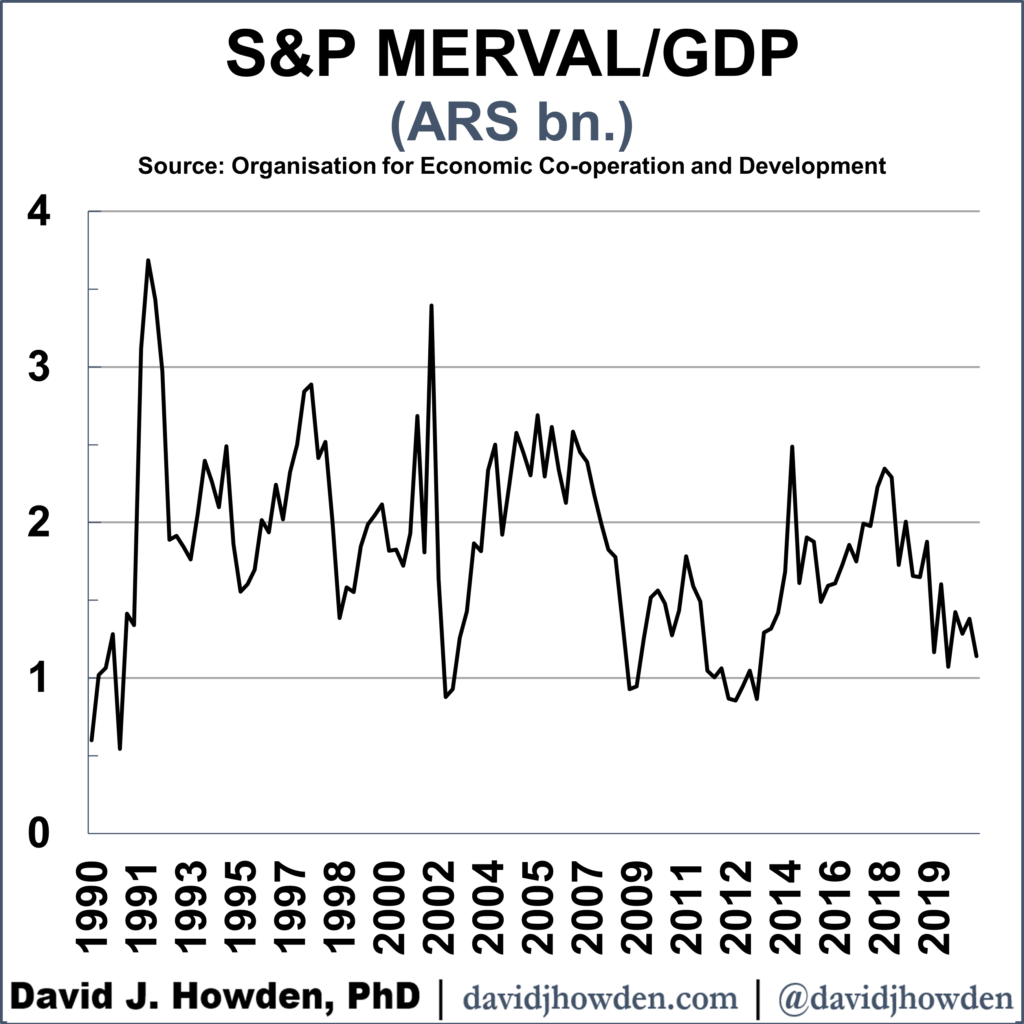
Here we can see the stock market peaks in 1992, 1997, 2000, 2007, 2014, and 2017. Each of those peaks in the ratio was followed by a significant decline.
The ratio bottomed in 2002, 2009, and 2012. Each of these lows was followed by a significant rally as money flowed from the real economy into the financial sector. The 2020 low in the ratio, at AR$1.1 bn. is one of the lowest figures on record. Since then the ratio has not increased significantly, pointing to the potential for the market to surge higher as the bull market picks up steam.
The relative valuation measure shows that Argentine equities are close to record lows relative to other prices in the economy. The low MERVAL-to-money supply ratio signifies that these equities are also cheap relative to the recent increases in the country´s stock of currency. Finally, the MERVAL remains lowly valued relative to Argentine GDP, pointing to a potential source of growth as the stock market catches up to growth in the real economy.
Which specific Argentine companies are going to benefit from the country´s loose monetary policy is anyone´s guess. But the market as a whole, represented by the S&P MERVAL index, has all the makings of a looming bull market.