With all the turmoil going around Evergrande and the Chinese real-estate market at the moment, it´s good to have some principles to set your bearings. Taking a step back and looking at the Chinese stock market objectively can shed some light on what the future holds. I don´t know what´s going to happen to the property developer, but in the grand scheme of things it´s probably not as consequential to the larger market than you think.
Here are the top seven reasons that the Chinese market, proxied by it´s main stock index, the SSE Composite, is not going to crash imminently. By the end you´ll see that there are actually quite a number of green shoots for the investor to nibble on.

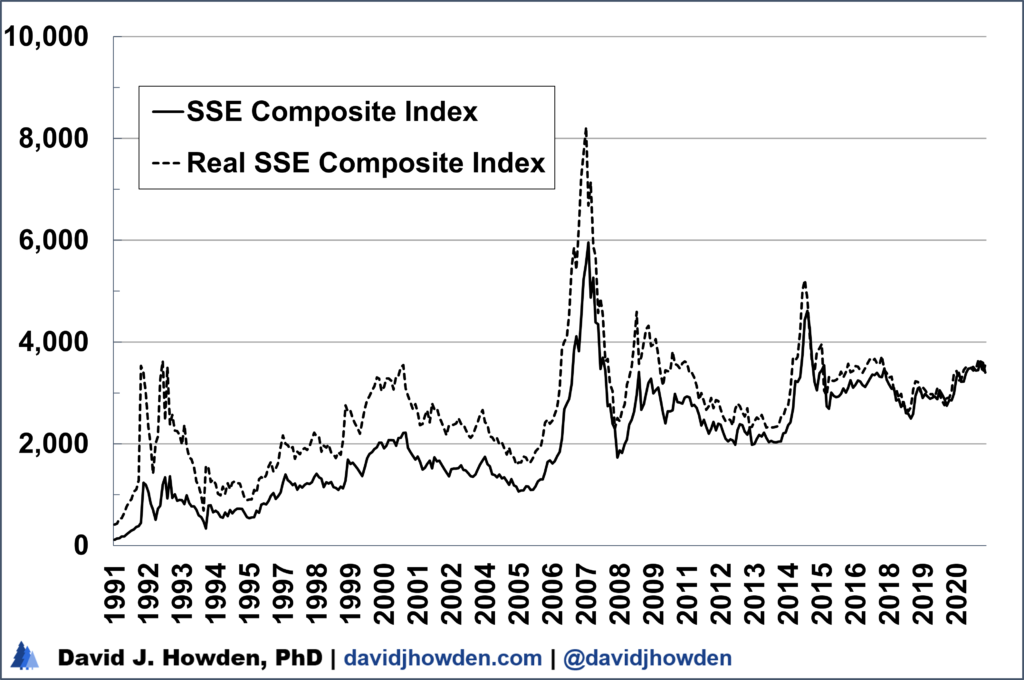
Let´s start by getting a bearing on the Chinese market. Here´s a chart the value of Shanghai Stock Exchange (SSE)index, the country´s leading benchmark for equities. I´ve adjusted it for inflation also to get a feeling for how stock values has evolved over time in real terms.
It doesn´t exactly *look* overvalued. I know hat´s not the most scientific way to start, but often times your gut doesn´t lead you astray.
We can see the booms of1993, 2007, and 2015 pretty easily. But you´d have a pretty hard time arguing that the SSE is currently overvalued by this historical standard. After all, in real terms the index is still below its 2000 peak! On any stock market that you look at, twenty years is a long time for a market to be underwater in real terms and still be considered overvalued. This time and this market are probably not different.
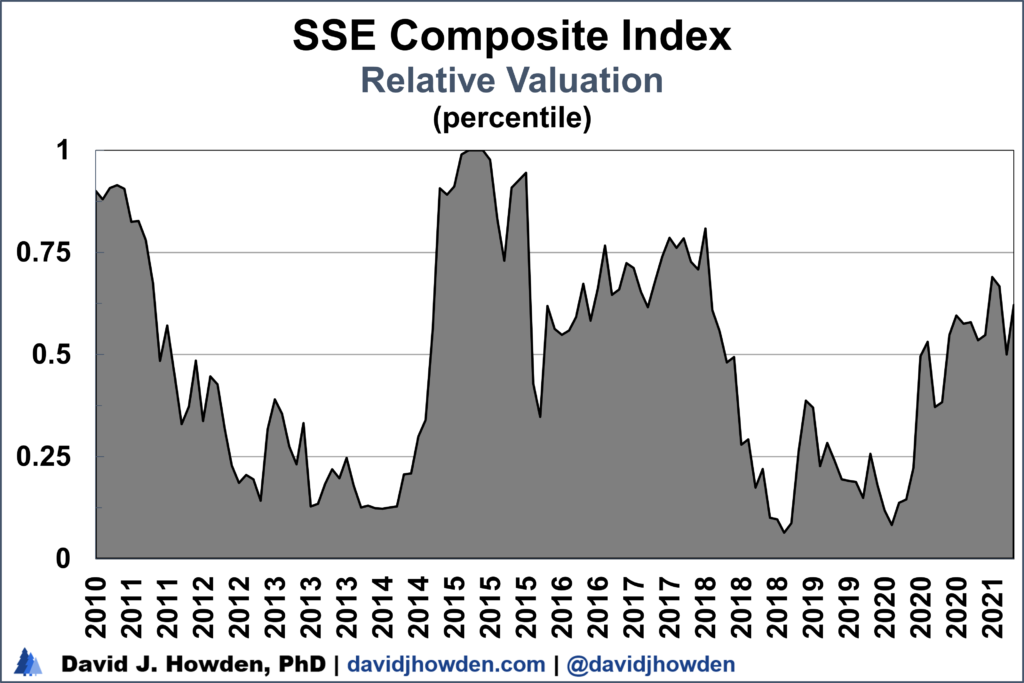
Let´s look at the index´s valuation a little more scientifically. I´ve developed a measure called relartive valuation to guage how expensive or cheap a market is relative to other prices in the economy. It´s expressed in percentiles. If you were in the zero percentile, it would mean that there was no momment the index was as cheap relative to other Chinese goods. A percentile of 1 (or 100%) means that the index has never been more expensive relative to other goods. The 50th percentile is an average valuation–the market would be more expensive than half the values throughout its history and cheaper than the other half.
Right now the valuation of the SSE Composite places it in the 62nd percentile. That´s a little overvalued by historical standards. But it´s no where near the overvaluations that accompanied the 1993 peak (91st percentile), let alone the 2007 peak (98th percentile).
We can also see some periods where Chinese equities were selling at a deep discount. Deep discount here means relative to other Chinese goods. 2013, 2018, and 2020 really jump out at us. Those were historically very good years to invest in the Chinese market.
Long story short, the Chinese market is overvalued by really not by much. And historically a market crash only followed much more extreme valuations.
Earnings are an important driver of equity prices. A large swath of the Chinese economy is in real estate, and that is what many commentators are pointing to right now in light of the Evergrande problems.
Chinese economic growth has tempered significantly over the past decade, but it is still robust by international standards. Since 2011 Chinese GDP increased by nearly 8% annually in real terms. That´s four times what the United States pulled off over the past decade, and six times what Germany managed.
Even if Chinese income took a hit, the growth rate would still be several times higher than pretty much any other country in the world. As the country continues to grow the rate will slow naturally due to the catch-up effect, but it looks like any serious slow down is still in the future.
Economic growth matters, but really we should normalize it somehow. The graph of Chinese economic growth is in nominal and inflation-adjusted terms so we can get a feel for real growth, but there are other ways to normalize the data.
Since we´re concerned with the stock market, why don´t see look at how many points of the SSE index account for each billion of Chinese yuan worth of income. This ratio of the SSE Composite index-to-GDP spikes at market tops as stock values increase at a faster rate than the general economy.
We can easily see the spikes that accompanied the market tops in 2001, 2007 and, to a lesser extent, in 2015. There has never been a major correction in Chinese equities without a sharp increase in this ratio.
At 0.028 points of the SSE to each billion yuan of GDP, this ratio has almost never been lower. In fact, it has been flat since 2018 and despite a small uptick over the past year, it is no where near the spike that accompanies a major market correction.
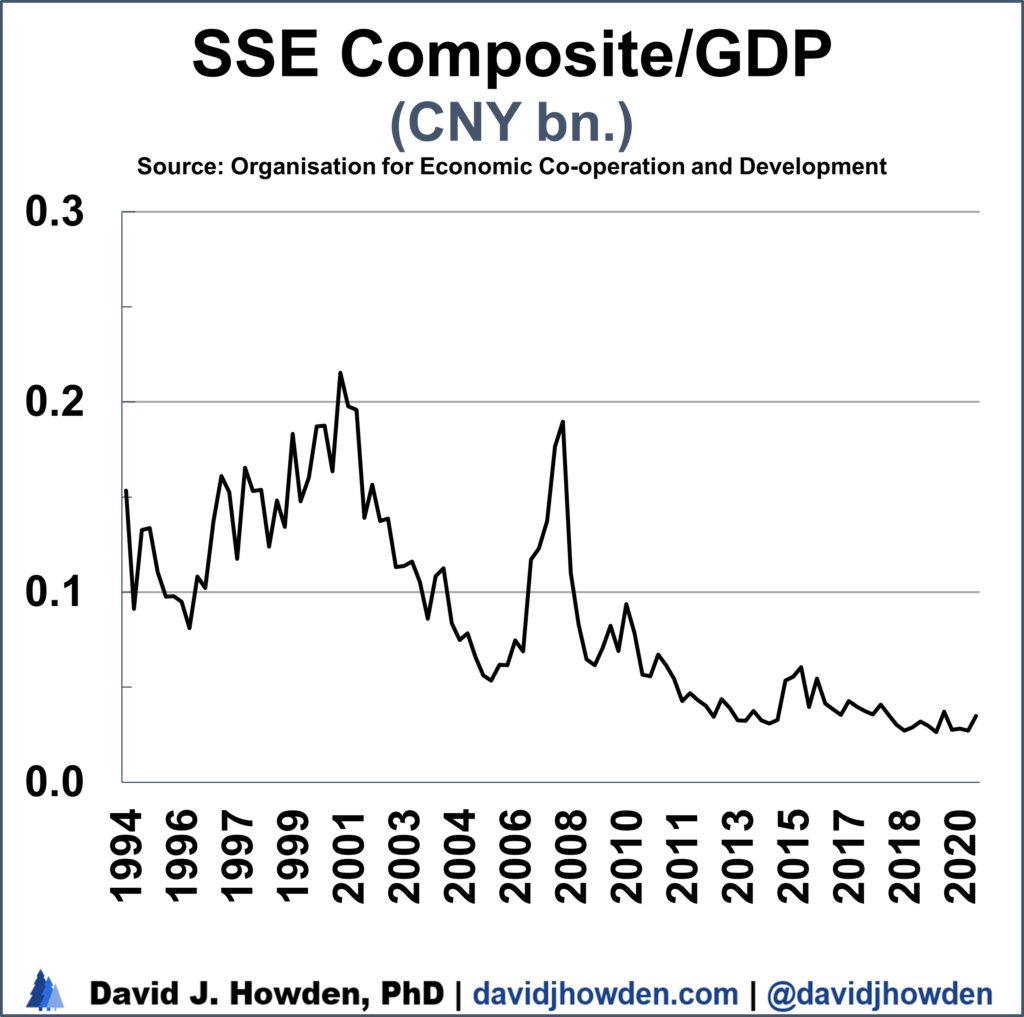
GDP growth is still strong in China, if not compared to the China of last decade than at least relative to the rest of the world. Furthermore, the SSE Composite index doesn´t look especially overvalued relative to income.
It´s pretty common to read about money supply growth and how this casts an ominous shadow over the markets. With the monetary mischief that the world´s central banks have been up to forever over the past decade, this feat is understandable.
M1 in China is growing at a slower rate than in more than twenty years, so it´s not exactly like it´s surging forward to cause mayhem in the markets. The US money supply has increased by over 25% annually over the past decade, so the People´s Bank of China might not have the tightest monetary policy, but it´s far from the loosest.
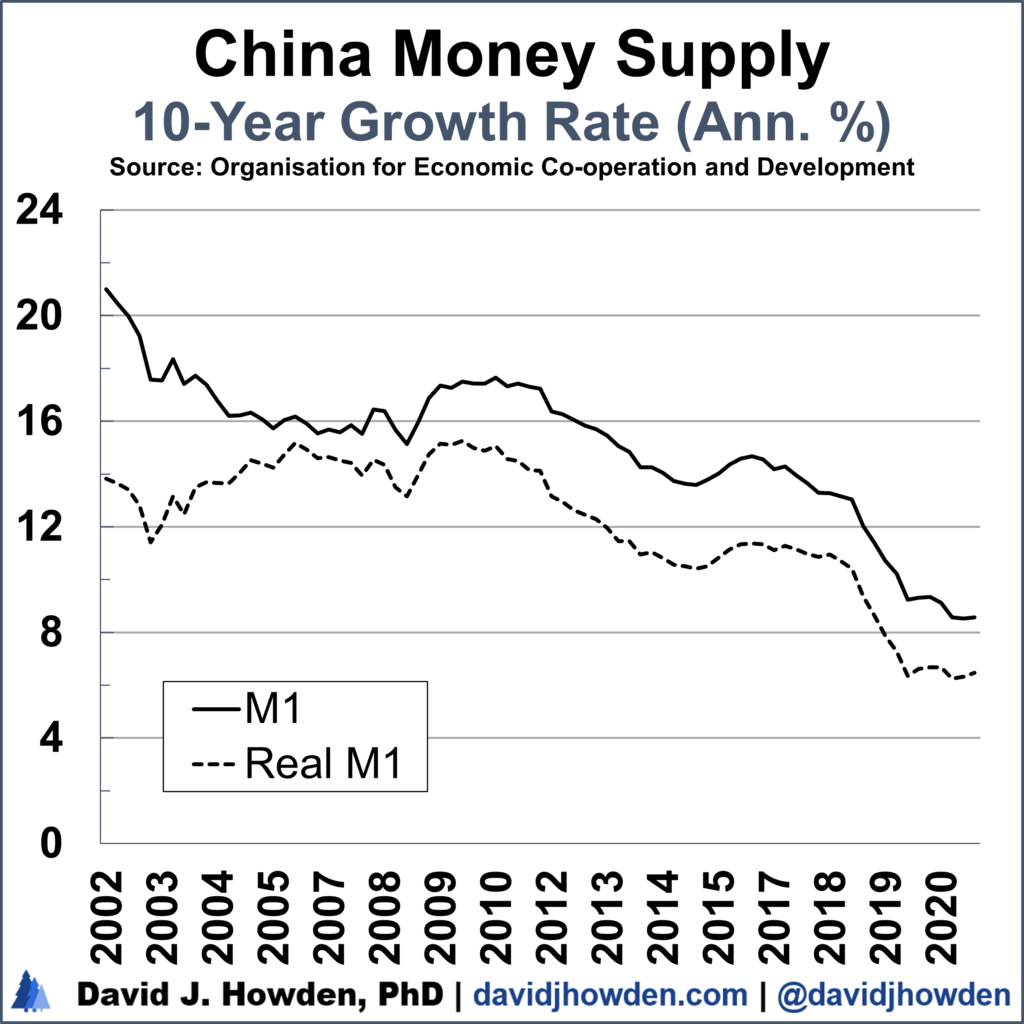
Again, as was the case with our look at GDP, it´s hard to tease out any implications by looking at a statistic without normalizing it somehow. Looking at inflation-adjusted values lets us compare them over time, but since we are concerned chiefly with the future of the stock market, it´s helpful to use equity values as a standard to compare the money supply to.
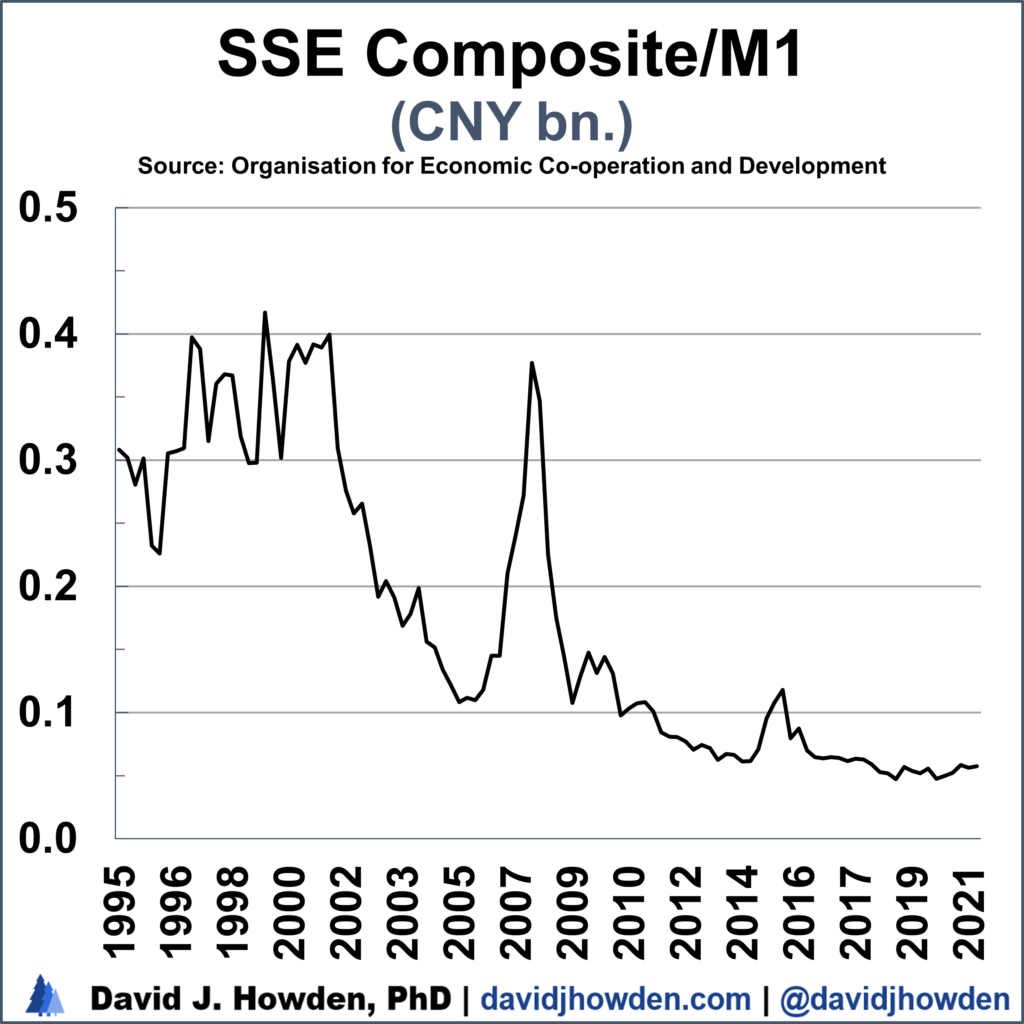
The ratio of the SSE Composite index-to-M1 tells us how many points of the index account for each billion of yuan worth of Chinese money supply. As was the case with the index-to-GDP ratio, it spikes at market tops. We see this in 2001, 2007, and to a lesser extent in 2015. There has never been a sizeable market crash without a preceding surge in this ratio.
For every billion worth of yuan of Chinese M1 there are 0.058 points on the SSE index. This ratio is about as low as the ratio has ever dipped. Since bottoming in 2019 the ratio has hardly budged.
New money has to end up somewhere. It could be spent on goods and services, which would increase income and translate into higher equity prices for the Chinese firms that supply them (and would be reflected by the index increasing). The new money could also work its way into the financial markets directly, either pushing down bond yields or bidding up stock prices. There hasn´t been any noticeable affect from the recent increases in the money supply on the stock market, which signals that the movement higher for Chinese equity values is yet to come as the money works its way through the economy.
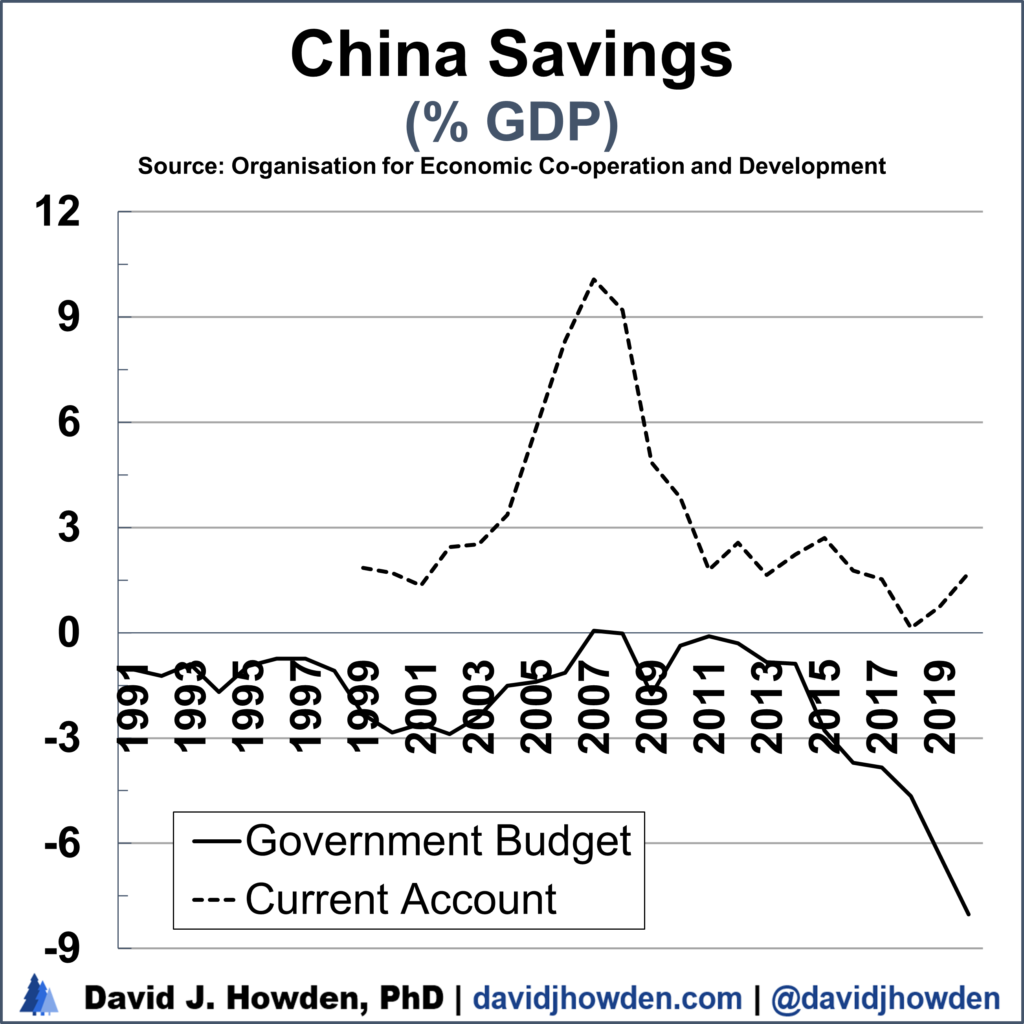
Finally, the Chinese government’s budget and the country´s current account are commonly discussed as a source of concern for the future of the stock market. The government´s budget is certainly not in great shape. It´s sucking a lot of savings into Chinese government bonds that could have ended up invested in equities. But taking a more objective look reveals that the country´s fiscal irresponsibility is not too bad compared with most other countries.
The United States had a budget deficit over twice as large as China in 2020, and doesn´t exactly look set to get back on track any time soon. Chinese government finances don´t exactly look attractive, but they might be the prettiest ugly girl at the ball.
Finally, China used to be in the news for its large positive current account. The supplier of the world´s goods, its large positive export balance kept the world awash in everything from airpods to zinc supplements. What was not so commonly commented on was that the country´s large current account balance was also indicative of a large amount of Chinese savings heading abroad to be invested. A lot of this ended up in US government bonds, but it also showed up elsewhere. Both Inter and AC Milan football clubs are owned by Chinese consortia, as are countless other clubs as well as other investments.
There are over 600 billionaries in the country, but not very many places they can invest their riches domestically. As they took their savings out of the country, something we can see through the country´s positive current account balance, the Chinese stock market faced headwinds.
That situation has been slowly changing. The country´s current account is still positive, but at less than 2% of GDP it´s a far cry from the greater than 10% it held less than a decade ago. As Chinese investors keep their money at home and make use of the Chinese markets, equities listed in Shanhai and Shenzhen see a boost.
There you have it, the top seven reasons why the Chinese equity market is not poised for a sizeable imminent collapse. I´ll throw in a bonus reason for good measure.
In my Almanac of Global Equities I forecast the future of the world´s major stock indexes over the coming decade. It´s not perfect, but it´s a good guide for seeing which markets are undervalued and which ones to stay away from. The methodology statistically tests the relationship between several key economic variables, some of which we´ve just looked at, and the market return in the future.
The past isn´t a perfect guide for the future. But if you need a roadmap before setting out in unchartered territory it´s a good place to start to get your bearings.
My model currently prices the SSE Composite index to deliver an annual return of 6.4% over the next five years, and 5.4% over the coming decade. That´s just in price terms. Dividends are not high as a general rule on Chinese equities, but should be enough to push the investor´s total return to 7-8% annually. Not incredibly high by historical standards, but no where near crash territory either.