With US equities trading at record highs, investors have a difficult choice: what investment path should I choose to secure superior returns? The choice is normally between stocks and bonds, but with bond yields also near record lows, the choice is unclear. Commodities are not everyone´s cup of tea, but there is good evidence that they will be the better investment bet over the coming decade.

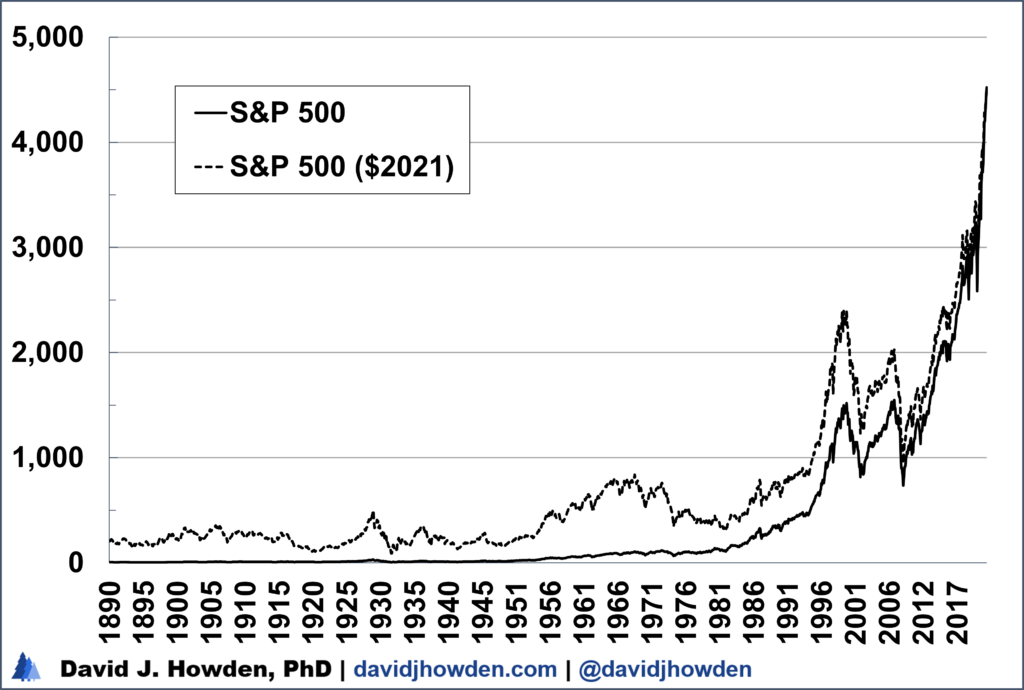
First, the case against equities. At least in the United States, the major stock indexes are at record highs and have been for some time. The S&P 500 has gone parabolic over the past year.
On the plus side, we can see that stocks have been a very good bet over the long run. The unfortunate part of that mantra that doesn´t get so much coverage is that lengthy bear markets punctuate the long run. The investor´s horizon at the best of times is not much longer than 20-40 years. Over the past century, there are a few bear markets that have held investors underwater for decades at a time.
There is a pretty wide array of commodities to chose from. Precious metals are the most explored by the investor, but energy (crude oil, gasoline, natural gas) and some agricultural products (wheat, corn) also pop up frequently.
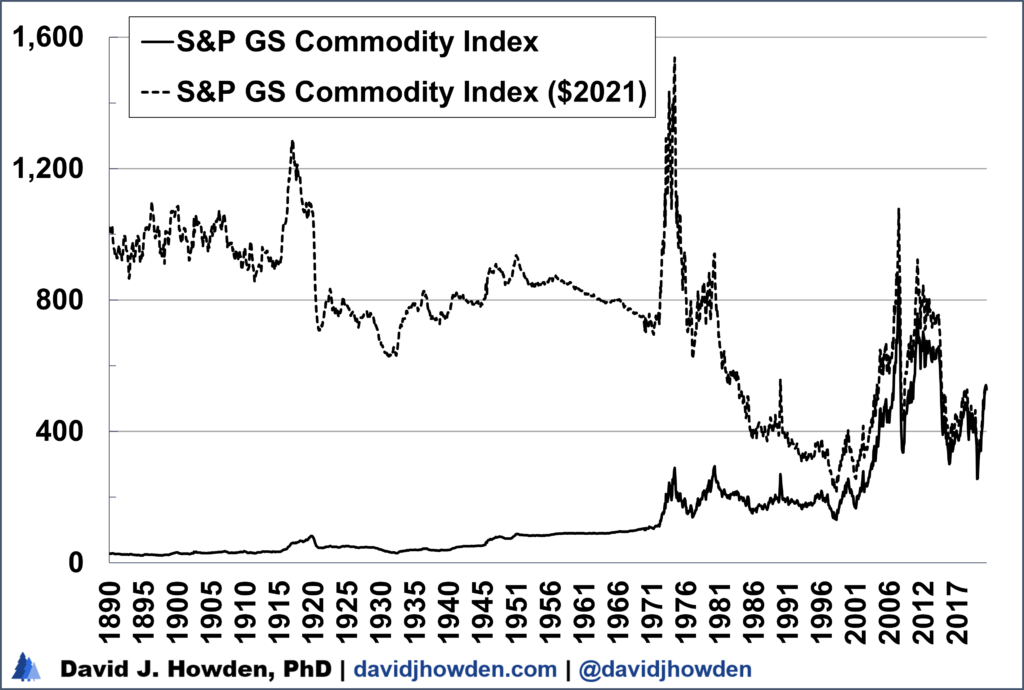
The most used index to track a basket of commodities is the S&P GS Commodity Index. (Launched by Goldman Sachs, Standard & Poor´s too over the index in 2007.) Using this index let´s see how the average commodity has fared over its history.
On balance, the past 130 years have seen a clear decline in commodity prices when reckoned in real terms. This accords with some common sense. Production technology has improved for many extraction processes, and the increase in supply has outstripped new demands.
A few swift bull and bear markets have broken up this long-term declining real price trend for commodities .
The First World War coincided with the first price spike, lasting from 1911 to 1920. Commodity investors of a certain age still remember the sharp bull market from 1971-74. And most people can still remember the golden years between 1998 and 2008.
Stocks and commodities provide two investment paths, and we need to decide which way to go when we reach the fork in the road as we rebalance our portfolios. Stocks have been a much better bet on average over long periods of time. Commodities have been losers over the long run, but have provided some outstanding returns during their bull markets.
One way to get a feel for when it was a good time to be weighted in stocks and when exposure to commodities was the better bet is by comparing the return to the S&P 500 and the S&P GS Commodity index over time. In the graph below I show the excess return by investing in the stock index over commodities over each subsequent ten-year period.
The usual suspects stand out, signaling great moments to invest in stocks. The investor who bought the S&P 500 around 1919, 1960, 1974, and 2009 earned about 25% more annually than he would have if he bought the S&P GS Commodity Index.
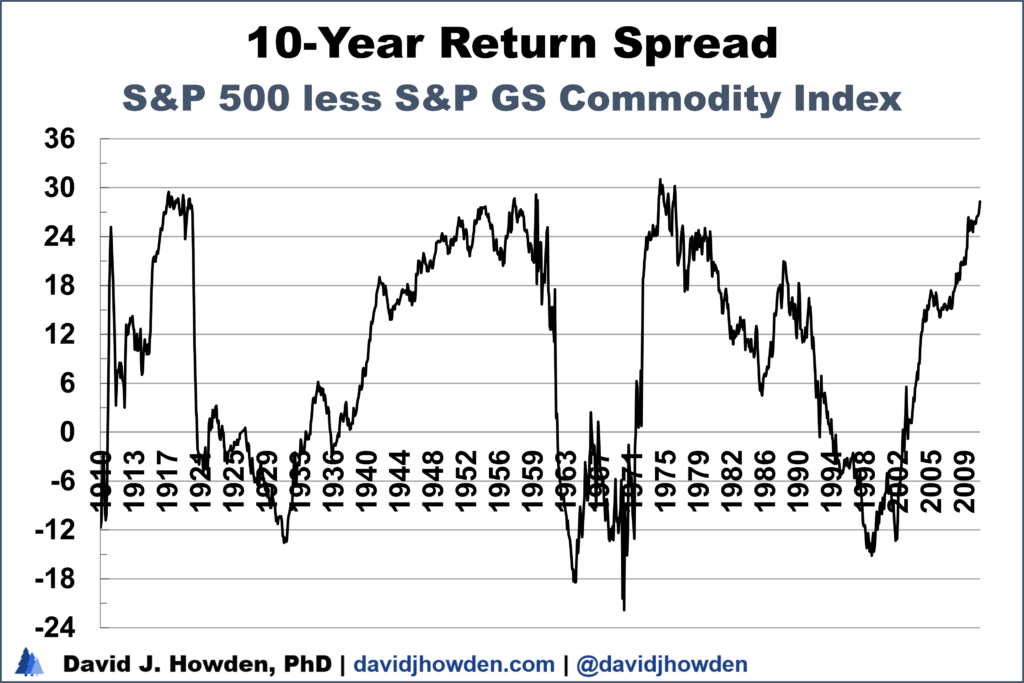
The investor who bought stocks in September 1974, for example, earned 15.4% annually over the next decade. (This includes reinvested dividends.) In contrast, if he had bought the commodity index, the next decade would have wrought a loss of 15.6% annually. The difference of 31.0% is the excess return the investor earned from holding stocks rather than commodities over the period. It´s also the greatest excess return from holding equities over a decade-long period of the 100 years under examination here.
For the most part, stocks have outperformed commodities. The investor would have been better served, on average, by being more weighted in the broad-based stock indexes. There have been some definite moments when stocks turned out to be real losers.
Buying stocks around 1929, 1964, 1970, and 1999 all resulted in a loss relative to holding a portfolio weighted more in commodities.
If an investor bought the S&P 500 in May 1999, he would have earned a total return of -1.7% annually over the next decade (adjusted for inflation). In contrast, if the investor had bought the S&P GS Commodity Index would have earned a positive return of 12.9% annually over the same period. Stocks underperformed commodities by 14.7% annually for the whole decade. (Another way to say it is that commodities outperformed stocks by 14.7% annually.)
Clearly what the investor needs is a way to separate the wheat from the chaff: a method to know when to invest in stocks and when to hold commodities. Holding commodities over most extended periods resulted in a loss. Holding stocks for almost all extended periods earned a gain, but he can improve on this gain if the investor intelligently reallocated his portfolio to avoid devastating bear markets in stocks and to capitalize on sharp swings in commodity prices.
One way to look at how over or undervalued a financial asset is priced is by way of what I call relative valuation. By comparing an asset´s price to other goods and services that the investor could spend his money on, we get a feel for how highly or lowly valued a stock, commodity, or currency is.
Here I use the same measure to look at the S&P 500 and S&P GS Commodity index, but with a twist. Instead of only comparing them to other goods, like cars, clothing, food or many of the other prices permeating through the economy, I instead compare the value of one index against the other.
In the graph below I illustrate the value of the S&P 500 index relative to the S&P GS Commodity Index. The higher the percentile means the more overvalued the stock index is relative to commodity prices.
In September 1971 equities were valued in the 100th percentile, making them more expensive relative to commodities than ever (since the analysis begins in 1910). If the index trades at the 50th percentile, it means that it is fairly valued against commodities. (Technically it means that the stock index has been more expensive than commodities for half of its history, and cheaper for the other half.)
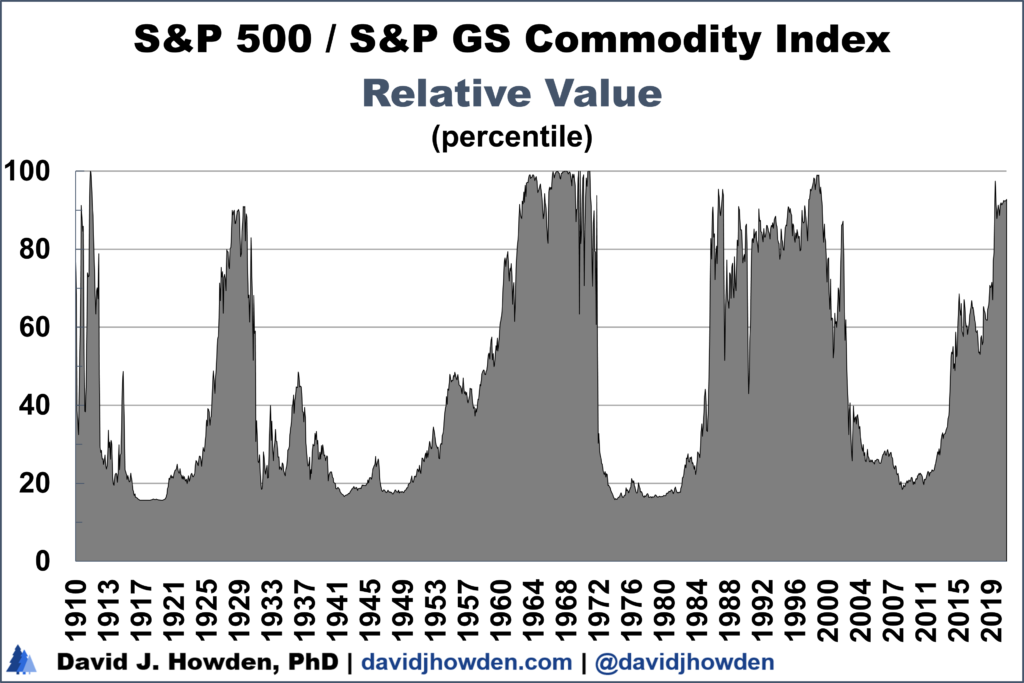
Here is a measure that we can use in real-time to signal periods when equities are expensive relative to commodities.
When the S&P 500 traded at the 90th percentile or higher against the S&P GS Commodity Index, stocks generally underperformed commodities by a hefty margin. These periods include 1911, 1929-30, 1963-71, 1998-99, and, well, now. Since March 2020 the stock index has been priced above the 90th percentile relative to commodities.
In 1911 stocks outperformed commodities over the next decade by about 6% annually. Of course, stocks had a bear market during the period, but poor commodity returns drive most of that excess return. Over a period shorter than a decade the investor would have avoided some stock losses, but the whole decade was long enough for equity prices to rebound back for a gain.
We know the history of 1929 pretty well, but one statistic that you probably don´t know is that commodities outperformed stocks by a margin of about 8-10% annually over the 1930s. Stocks posted negative returns and commodities, even in a deflationary environment, increased in price by 6-7% annually over the period. (This is the average commodity price, remember, since we are using a broad-based index. Some commodities, like crude oil, increased in value by over 100% in real terms during the 1930s.)
If you bought the S&P 500 any time between 1963 and 1971, your portfolio would have lost about 9% annually against a portfolio of commodities. Your stocks would have still yielded positive real returns over each of those ten-year periods, albeit relatively small positive returns. But the gains of commodities over the decade dwarfed this gain.
With the benefit of hindsight, we know that 1998-99 was a pretty terrible time to buy stocks. Now we can quantify how bad it was by looking at the excess return relative to holding commodities during the decade after. On balance, the investor who bought stocks earned an annual loss of 12.5% relative to the investor who bought commodities in the late 1990s. Furthermore, while most of those ten-year periods were losses for the equity investor in absolute terms, all of them left the commodity investor ahead.
We don´t know what the return of the stock market will be over the coming decade. And we have little idea of where commodity prices are going. But we can shed light on where equity prices will go relative to commodity prices by using this relative valuation measure.
Since March 2020 the S&P 500 has been above its 90th valuation percentile against the S&P GS Commodity Index. We know that in three of the four cases since 1910 this has been a strong signal to divest away from stocks and into commodities. Even in the fourth case (1911), the investor would have avoided a short stock market crash by getting out of stocks even if over the whole decade the market rebounded to end with a profit.
Taken together with the fact that stocks are trading at historic highs, and many commodities are still in the dumps since 2020, there is a pretty compelling case that a shift away from equities and into commodities will provide superior returns over the next decade.


[…] a recent post, I made the case that the run-up in stocks is drawing to a close, if not in absolute terms then at […]